Debugging ARM Cortex-M3 Devices with GDB and openOCD
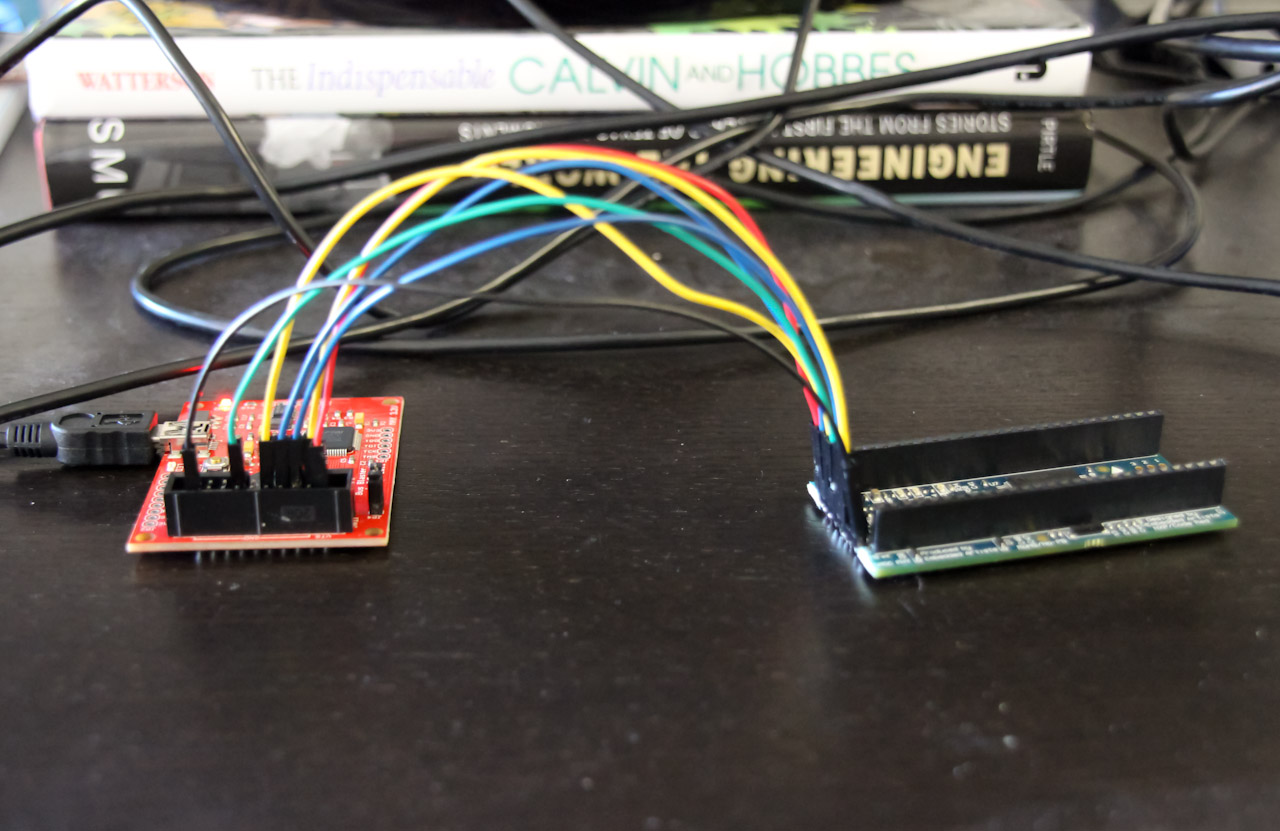
After getting the gcc-arm compiler working with the mbed, I decided to take a look at my LPCXpresso LPC1769 development board. The mbed is really easy to program. It mounts as a flash drive and you just drag and drop the binary file onto it. Unfortunately, that’s it. There is no way to get any debug information out of it. The LPCXpresso, on the other hand, comes with a nice LPC-link board attached just for this purpose. Unfortunately(again), it only works with certain IDE’s, like code_red. I cut the lpc-link board off and instead used a BusBlaster from Dangerous Prototypes along with OpenOCD. It took me a while to actually program the device, so I’ll leave that for later. This post is about debugging!
So why, you might ask, do I go to all this trouble to get a debugger working? Because debuggers are awesome! Without them, one has to resort to printf statements(if you’re lucky enough to have that working) and LED’s. Sure, those are useful sometimes, but having access to memory, registers, stepping through code, etc. makes debugging much easier!
- All of the following takes place in Ubuntu 12.04.
- I’m using a simple blinking led program as an example
- Here’s some info about openOCD and the BusBlaster
Compile your code with arm-gcc and make sure to pass the -g flag to generate debugging information.
Run openOCD to connect to the device.
$ openocd -f openocd.cfgRun GDB and connect to openOCD
$ arm-none-eabi-gdbtui -ex "target remote localhost:3333" blink.elfIf you see [No source available], it’s probably because the core is running. Do the following to halt it the first time:
(gdb) continue(gdb) Ctrl+cThe c source should now be visible
Setup split view to see dissasembly (if you want)
(gdb) layout splitDebug away!

It’s been a while since I use GDB, but here are some examples of commands that are useful:
- (gdb) Ctrl+C - Halts execution
- (gdb) step/next - step through a line (of c code)
- (gdb) stepi/nexti - step through an individual instruction
- (gdb) continue - Continue execution
- (gdb) break 22 - set a breakpoint in line 22 (you can also name a function instead)
- (gdb) delete - get rid of all the breakpoints
- (gdb) where/backtrace - print backtrace of all stack frames
- (gdb) info locals - see local variables
- (gdb) info registers - see all registers and values
- (gdb) x/2xw 0x2009C018 - show 2 words(in hex!) starting from memory address 0x2009C018
- (gdb) set {uint32_t}0x2009C018 = 0x400000 - set value of memory address 0x2009C018 to 0x400000
There are many more things you can do with GDB. For more info. check out Debugging with GDB.