Smart Meter Fun (Part 1)
My current apartment has one of those ‘smart’ electric meters that can communicate with the power company directly over the power lines. A few months ago, I found out about a smartmetertexas.com, which lets you register and get logs of your power usage in 15 minute increments. I thought that was really awesome and signed up. The concept is really cool, but unfortunately, their user interface isn’t that great. It does, however, allow you to export all of that information in one large csv file.
After getting the file, I decided to write a small python script to get some more information about my usage. Right now it doesn’t do much, but it shows me information like daily usage, hourly (ok, 15 minute-ly) averages, and weekday averages.

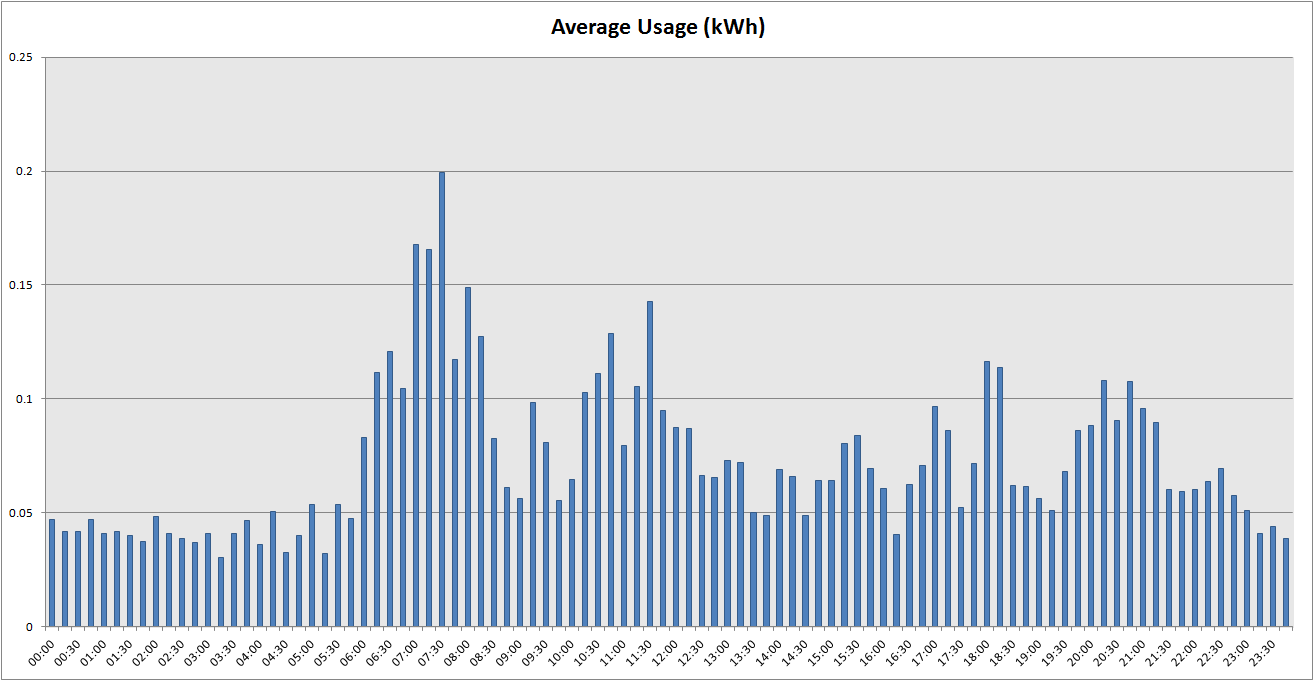
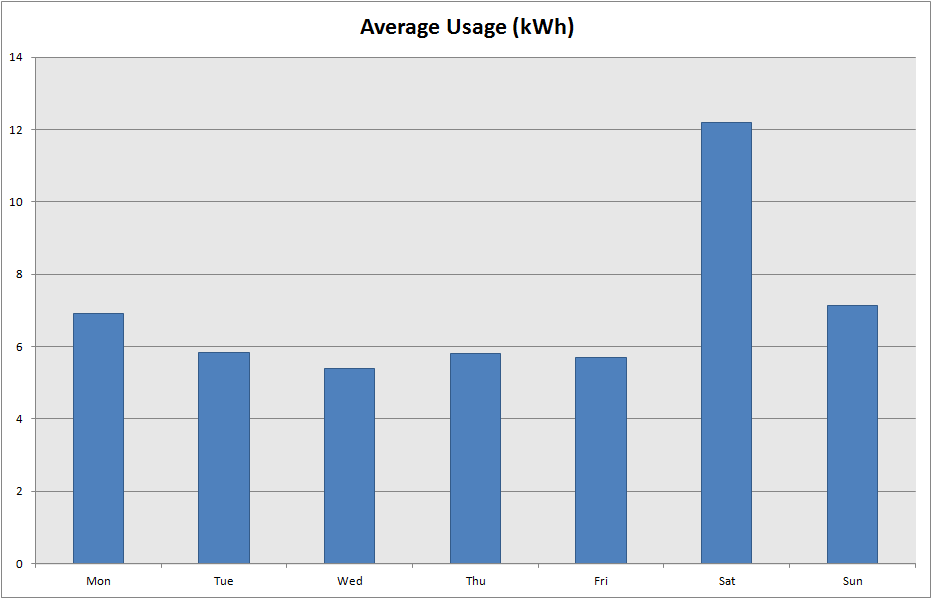
From looking at this data, I use the most energy on Saturdays (Washer, dryer, more tv than usual, etc…). It also seems that I use the most energy from 7:30-7:45am. That’s usually when I’m making breakfast and using the stove.
The next step will be to figure out how to automate the graphing process. Right now, I export to csv files and then plot with excel. Maybe I can use gnuplot or some python extension to do it all at once.
I’ll be putting the code I’m using up on github: https://github.com/alvarop/smartmetertexas_reader